
Expected Outcomes Cervical & Lumbar Disc Replacement
What patients can realistically expect from cervical and lumbar disc replacement surgery. Comprehensive evidence-based review of pain relief, functional improvement, return to activity, and long-term durability outcomes.
Patient Satisfaction
Long-Term Success
85-95%
High satisfaction rates with disc replacement surgery, with the majority of patients reporting they would have the procedure again.
Pain Reduction
Substantial Relief
70-90%
Evidence shows significant improvement in pain scores at one year, with 50-60% of patients achieving complete pain resolution.
Proven Durability
Motion Preserved
13+ Years
Long-term studies demonstrate sustained pain relief and motion preservation with modern disc prostheses over extended follow-up.
Understanding "Success" in Spinal SurgeryWhat the Evidence Shows
Informed patients understand that surgery is a medical intervention, not a guarantee of perfect outcomes. Success in disc replacement surgery should be understood not as the elimination of all symptoms, but rather as substantial, sustained improvement in pain, functional capacity, and quality of life—permitting patients to return to activities, work, and pursuits previously limited by degenerative disease.
Defining Clinical Success
Clinical success in spinal disc replacement surgery is defined using standardised criteria established by the FDA and adopted internationally. The composite clinical success (CCS) standard requires achievement of all of the following:
Composite Clinical Success Rates
Patient-Perceived Success
Patient-perceived success often differs from clinical success criteria. Many patients define success as:
Pain elimination or near-complete relief
Achievable in 30–50% of patients
Return to all preoperative activities without restrictions
Achievable in 70–85%
Elimination of limitations on work or recreation
Achievable in 80–90%
High satisfaction with the surgical decision
Achievable in 85–95%
These patient-centred definitions, whilst more variable than strict clinical criteria, reflect what actually matters to those undergoing surgery. Research demonstrates that moderate pain relief combined with substantial functional improvement and activity restoration generally produces high patient satisfaction, even when complete pain elimination is not achieved.

Factors Associated with Better Outcomes
Evidence identifies several factors associated with superior surgical outcomes. Understanding these helps set realistic expectations and optimise preparation.
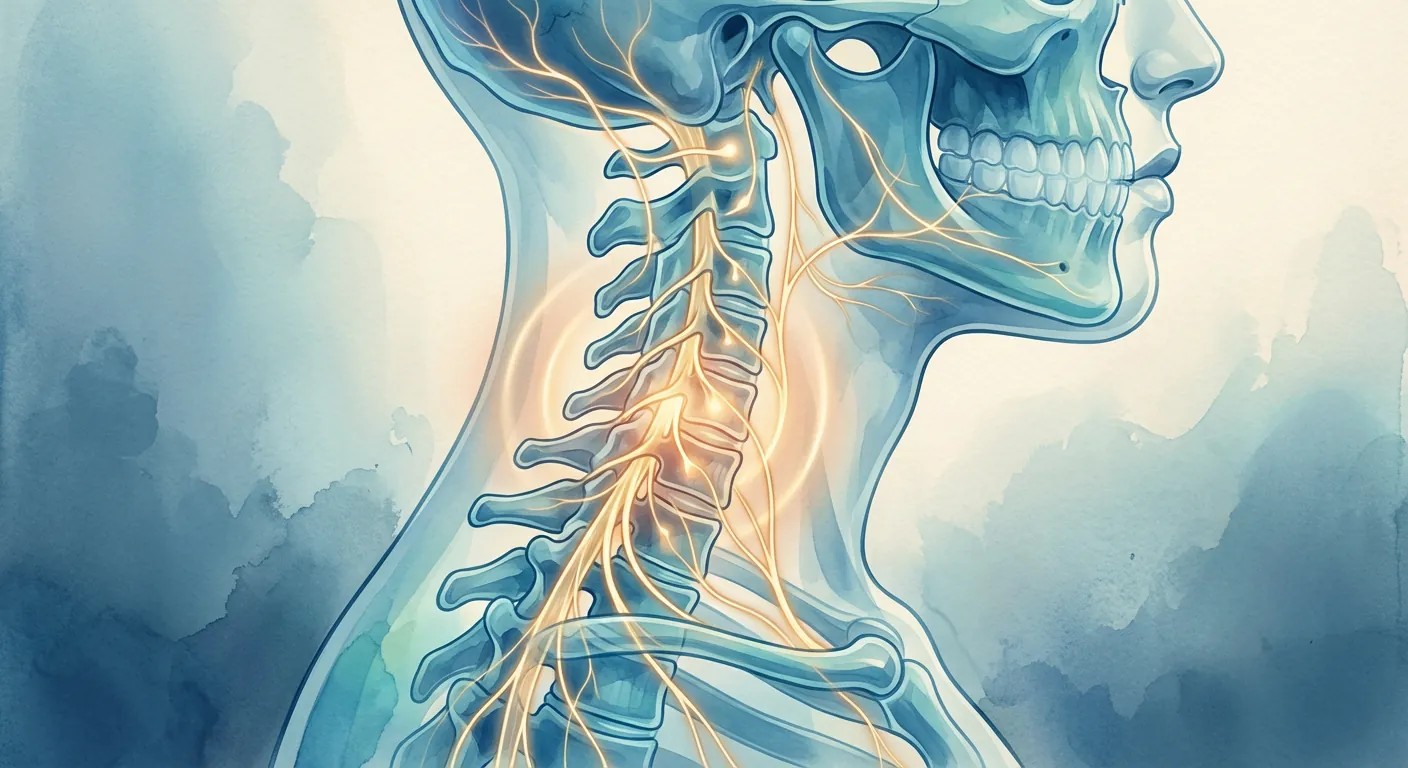
Cervical Disc ReplacementPain Relief Outcomes
Pain in cervical degenerative disease is measured using the Visual Analogue Scale (VAS), where 0 represents no pain and 10 represents worst possible pain. Research measures VAS Neck (pain localised to the cervical spine), VAS Arm (radicular pain from nerve compression), and NDI (composite measure of pain combined with functional disability, scored 0–100).
Preoperative Pain Characteristics
Importantly, preoperative arm pain typically exceeds neck pain, reflecting nerve root compression as the primary pathology.
VAS Arm Pain
Most patients experience dramatic arm pain relief immediately upon awakening from surgery (day 0–1), with ongoing improvement as inflammation resolves.
VAS Neck Pain
Neck pain improvement lags slightly behind arm pain relief, as inflammatory response from surgical trauma temporarily increases neck discomfort before settling over weeks 2–6.
Neck Disability Index
This 15-point NDI improvement exceeds the Minimal Clinically Important Difference (MCID) threshold of 10–15 points, confirming that 6-week functional improvement is clinically meaningful.
Key Insights at 6 Weeks
- 50–70% arm pain relief achieved by 6 weeks
- Approximately 40–50% achieve near-complete arm pain resolution
- Functional improvement exceeds MCID threshold
Pain Relief Plateau: When Improvement Stabilises
Important principle: Pain and functional improvement plateau between 3–6 months postoperatively for most patients. Additional pain reduction occurring after month 3 is typically minor. Patients experiencing inadequate pain relief by 3 months are unlikely to achieve substantial further improvement without specific intervention.
This principle is critical for patient expectations: if pain is not improved satisfactorily by 3 months, additional interventions (physical therapy optimisation, pain management, rarely revision surgery) should be considered rather than passive waiting.
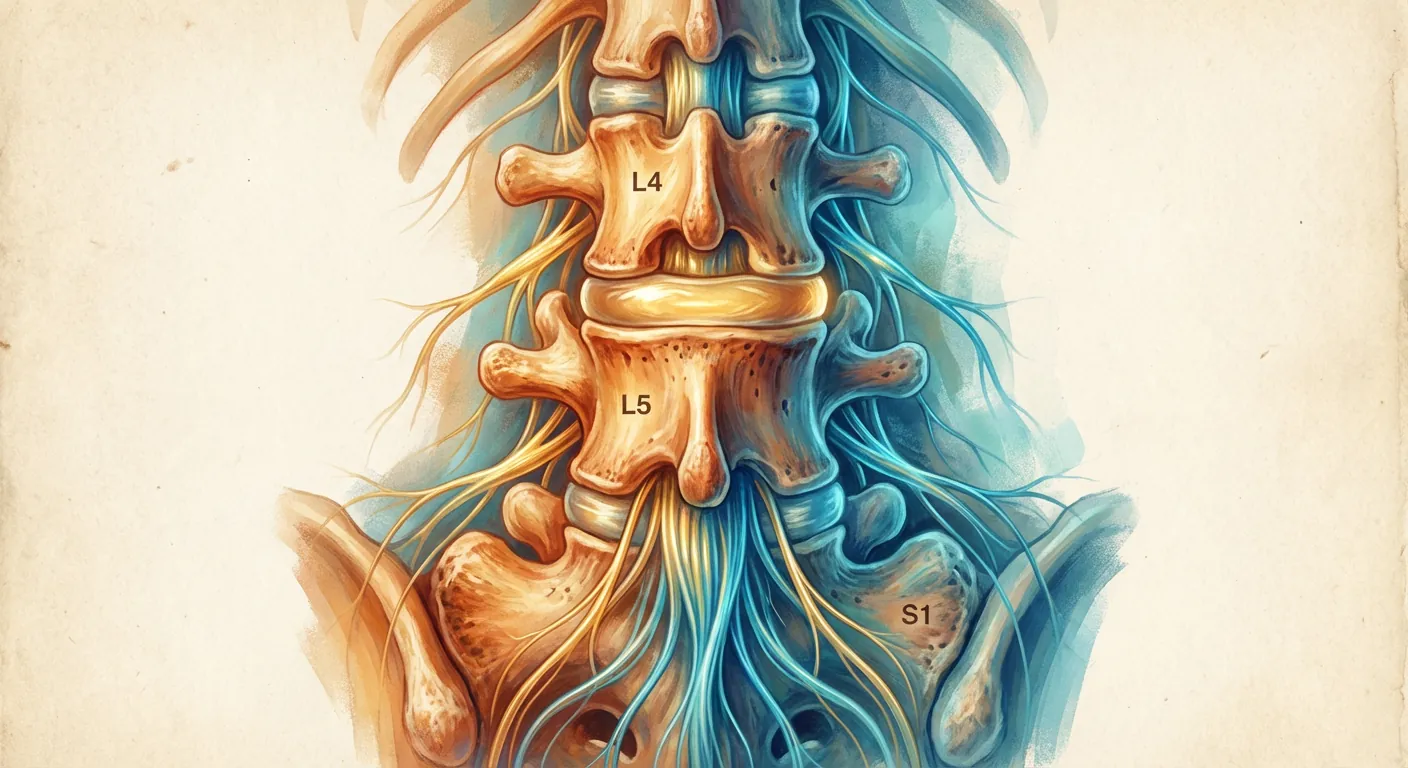
Lumbar Disc ReplacementPain Relief Outcomes
Lumbar disc replacement demonstrates substantial pain relief with documented durability extending to 13–14 years. The procedure addresses both axial low back pain and radicular leg pain from nerve compression.
Preoperative Pain Characteristics
VAS Low Back Pain
VAS Leg Pain
Oswestry Disability Index
- Initial healing phase with significant improvement
- Leg pain relief typically faster than back pain
Some patients experience persistent pain despite adequate surgical decompression. Research identifies factors associated with inadequate pain relief:
Preoperative Factors
- High preoperative disability
- Multiple comorbidities
- Depression/anxiety
- Poor health-related quality of life
Disease Factors
- Severe preoperative facet joint arthritis (grade 3–4)
- Marked endplate degeneration or severe osteoporosis
- Imaging-clinical mismatch
Psychological Factors
- Catastrophising
- Fear avoidance
- Central sensitisation
Research finding: For these patients, multimodal pain management, optimisation of physical therapy, and consideration of psychological support optimise outcomes.
Return-to-Work TimelineEvidence-Based Expectations
A 2025 systematic review and meta-analysis of 16 RCTs (5,657 patients) compared return-to-work outcomes between CDR and ACDF.
CDR vs ACDF Return-to-Work Advantage
Occupation-Specific Timeline

Sedentary Occupations
Predictors of Earlier Return-to-Work
Graded Return-to-Work
Activity ResumptionWeek-by-Week Progression
Activity Progression Framework
Sport-Specific Return Timeline

Cervical CDR Athlete Population
Lumbar TDR Athlete Population
Sports Commonly Resumed Post-Disc Replacement
Long-Term Durability10+ Years of Outcomes Data
Cervical CDR at 5 Years
Lumbar TDR at 5 Years

CDR vs ACDFLong-Term Outcome Comparison
Adjacent Segment Disease: The Critical Differentiator
Motion preservation significantly reduces stress on adjacent segments.
Cervical Procedures
Lumbar Procedures
Patient SatisfactionQuality of Life Outcomes
Cervical Disc Replacement
Lumbar Disc Replacement
Positive Outcomes Most Commonly Reported
Ongoing Concerns (in Those Not Fully Satisfied)
Quality of Life Metrics (SF-12)
Physical Component Score (PCS)
Substantial improvement in physical health perception
Mental Component Score (MCS)
Modest improvement in mental health perception

Realistic Outcome ExpectationsBy Patient Profile

Scenario 1: Single-Level Radiculopathy with Good Surgical Candidate
Expected Outcomes
Key Considerations
Factors Associated withLess Favourable Outcomes
Research finding: These patients may benefit from hybrid approaches, fusion, or more conservative management rather than isolated arthroplasty.
Patients can optimise outcomes through:
Research finding: Patients with multiple unfavourable factors should receive enhanced preoperative counselling, psychological support if indicated, and intensive postoperative rehabilitation to optimise outcomes.

The Timeline FrameworkPre-Operative Through Return to Life
Pre-Operative
Decision-Making (1–8 weeks)
- Treatment decision finalised
- Shared decision-making discussion
- Patient education reviewed
- Expectations clarified
Optimisation (2–4 weeks before)
- Medical clearance
- Smoking cessation initiated
- Baseline outcome measures
- Logistical planning
Immediate Pre-op (1 week)
- Final assessment
- Medication adjustments
- Fasting instructions
- Final questions addressed
Return-to-Life Transition (Month 3–4)
The transition from "post-operative recovery" to "return to normal life" typically occurs when:

Australian Healthcare ContextOutcomes & Access
Medicare Benefits Schedule Coverage
Both cervical and lumbar disc replacement and fusion procedures are covered under the MBS, reflecting evidence-based status as appropriate treatments. Eligible patients can access either motion-preserving arthroplasty or fusion approaches with Medicare support.
Outcomes Data Applicability
The outcome data presented herein comes from international multi-centre trials and registries including Australian patient populations. Outcomes in Australian public and private healthcare settings are comparable to international published results, reflecting modern surgical techniques and post-operative protocols.
Role of Shared Decision-Making
The evidence presented supports collaborative decision-making between patients and surgeons. Australian healthcare system promotes shared decision-making as standard care, ensuring patients understand options, realistic expectations, and evidence-based recommendations.
Evidence Gaps: What We Don't Yet Know
- Beyond 14 years: Long-term outcomes still accumulating
- Optimal rehabilitation protocols: Research continues
- Genetic predictors: No reliable markers yet
- Psychological factors: Role still being defined
Individual Variation
These guidelines present aggregate data from thousands of patients. Individual outcomes vary:
Conclusion: Understanding Expected Outcomes for Informed Choice
Cervical and lumbar disc replacement represent effective surgical treatments for appropriately selected patients with symptomatic degenerative disc disease. Expected outcomes include:
substantial improvement at 1 year; 50–60% complete resolution
meaningful NDI/ODI improvement; 75–85% RTW
return to all preoperative activities; 94–96% athletes resume sport
motion preserved 80–90%; reoperation 5–6% cervical, 3–5% lumbar
87–92% would have procedure again
Individual outcomes vary based on patient factors, disease characteristics, and surgical technique. Patients achieving the best outcomes typically combine medical optimisation, realistic expectations, active engagement in rehabilitation, and sustained commitment to long-term spine health.
The choice between disc replacement and fusion should be individualised, considering age, disease characteristics, imaging findings, occupational demands, and patient preferences—through shared decision-making with surgical providers.